
Historical gold price chart
What the history does and does not show
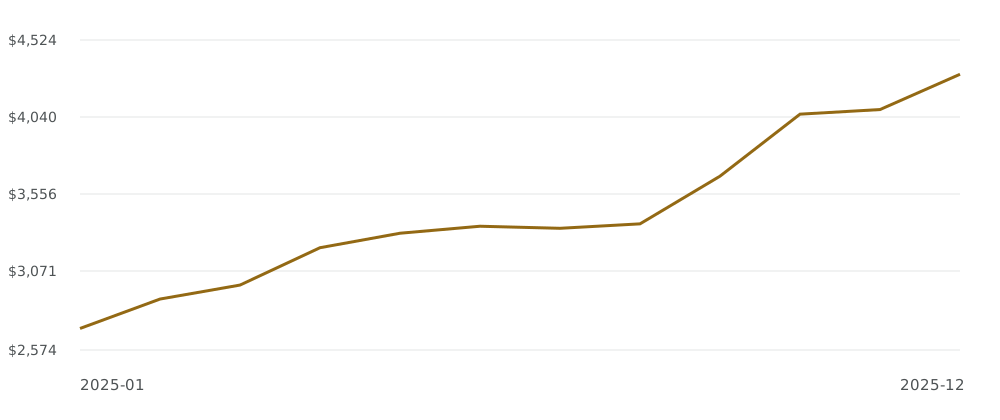
The chart follows one consistent source and unit. Monthly averaging smooths the price path: an event that produces a brief intraday spike may leave little trace, and the month’s highest and lowest transaction prices cannot be reconstructed from its average. Use the table to compare periods, not to claim that a buyer could have traded at an exact value on a particular day.
A US dollar chart also differs from a euro or sterling chart. Exchange-rate movements can raise a local-currency gold price even when the dollar reference is unchanged. These history pages deliberately keep the original USD series rather than converting decades of observations using today’s exchange rate, which would create misleading historical local prices. Current converted quotes belong on the live prices pages.
Read 2025 month by month
The twelve observations below cover January to December 2025. The summary above is the arithmetic mean of those twelve monthly averages; it is not a separately weighted annual benchmark. A day-weighted or trading-day-weighted series can differ slightly. Compare January and December to understand the endpoints, but remember that an investor’s purchase and sale dates may not coincide with either monthly average.
Nominal changes do not account for inflation, custody, insurance, product premiums, bid–ask spreads or taxes. A physical coin bought above spot and sold below spot can produce a different outcome from the reference chart. Historical appreciation cannot establish what happens next. For the drivers behind market moves, read why gold prices change.
Source and reuse
The data comes from the World Bank’s historical monthly workbook, Gold column on the Monthly Prices sheet. The source lists nominal US dollars per troy ounce. We retain the observation month, exclude non-numeric or non-positive values and display rounded amounts. This is an attributed extract, not a live mirror of the workbook or an LBMA historical data redistribution.
World Bank datasets are generally available under its dataset terms, with attribution and any applicable third-party notices. Check those terms if you reuse the source. MetalflowAPI remains the source of the live quotes and widget daily mini-charts on this website; those figures must not be confused with this monthly series.
Monthly observations: USD per troy ounce
| Month | Monthly average |
|---|---|
| 2025-01 | US$2,710 |
| 2025-02 | US$2,895 |
| 2025-03 | US$2,983 |
| 2025-04 | US$3,218 |
| 2025-05 | US$3,309 |
| 2025-06 | US$3,353 |
| 2025-07 | US$3,340 |
| 2025-08 | US$3,368 |
| 2025-09 | US$3,668 |
| 2025-10 | US$4,058 |
| 2025-11 | US$4,087 |
| 2025-12 | US$4,309 |
Compare ten years of gold prices · Current USD gold price · Embed a live gold price widget
Frequently asked questions
- Are these daily gold prices?
- No. Each observation is a monthly average in nominal US dollars per troy ounce from the World Bank Pink Sheet. It is not a daily close, intraday high or current dealer quote.
- Does this table cover all of 2025?
- Yes. The table contains the twelve monthly gold price averages from January through December 2025.
- Can I use a monthly average to value a sale on one date?
- A monthly average is useful context, not a transaction price. For a sale, use the buyer’s dated offer and a current quote in the same currency, weight unit and purity.
- Are these prices adjusted for inflation?
- No. They are nominal US dollar prices. Changes do not directly measure inflation-adjusted purchasing power or the return after trading costs.
- How do I compare this with jewellery prices?
- Divide the ounce price by 31.1034768 and multiply by fineness and gold-only weight. Retail jewellery also contains labour, stones and a seller’s margin, which are not included here.